Online Thermogram Monitoring for Paint-Shop Curing Ovens
A thermogram for every body leaving the curing oven, an automatic OK / NOK decision and a live 3D thermal digital twin
Location
Automotive paint shop · concept and live demo
Year
2026
Scope
System architecture and thermal modelling · 3D thermal digital twin (Three.js) · PLC, encoder and CIS integration design · Operator HMI and alarm handling · Body-in-white modelling in Blender
01 · The challenge
Waterborne topcoat only cures properly if the critical surfaces of each body stay above 140 °C for at least 20 uninterrupted minutes. Most plants verify this by strapping probes to a body and sending a Datapaq logger through the oven every so often. The data is read out afterwards, so nobody knows whether the hundreds of bodies in between actually met the recipe. A burner drop, a line stop or a local temperature drift usually shows up at the next profiling run – or at final inspection.
02 · Our solution
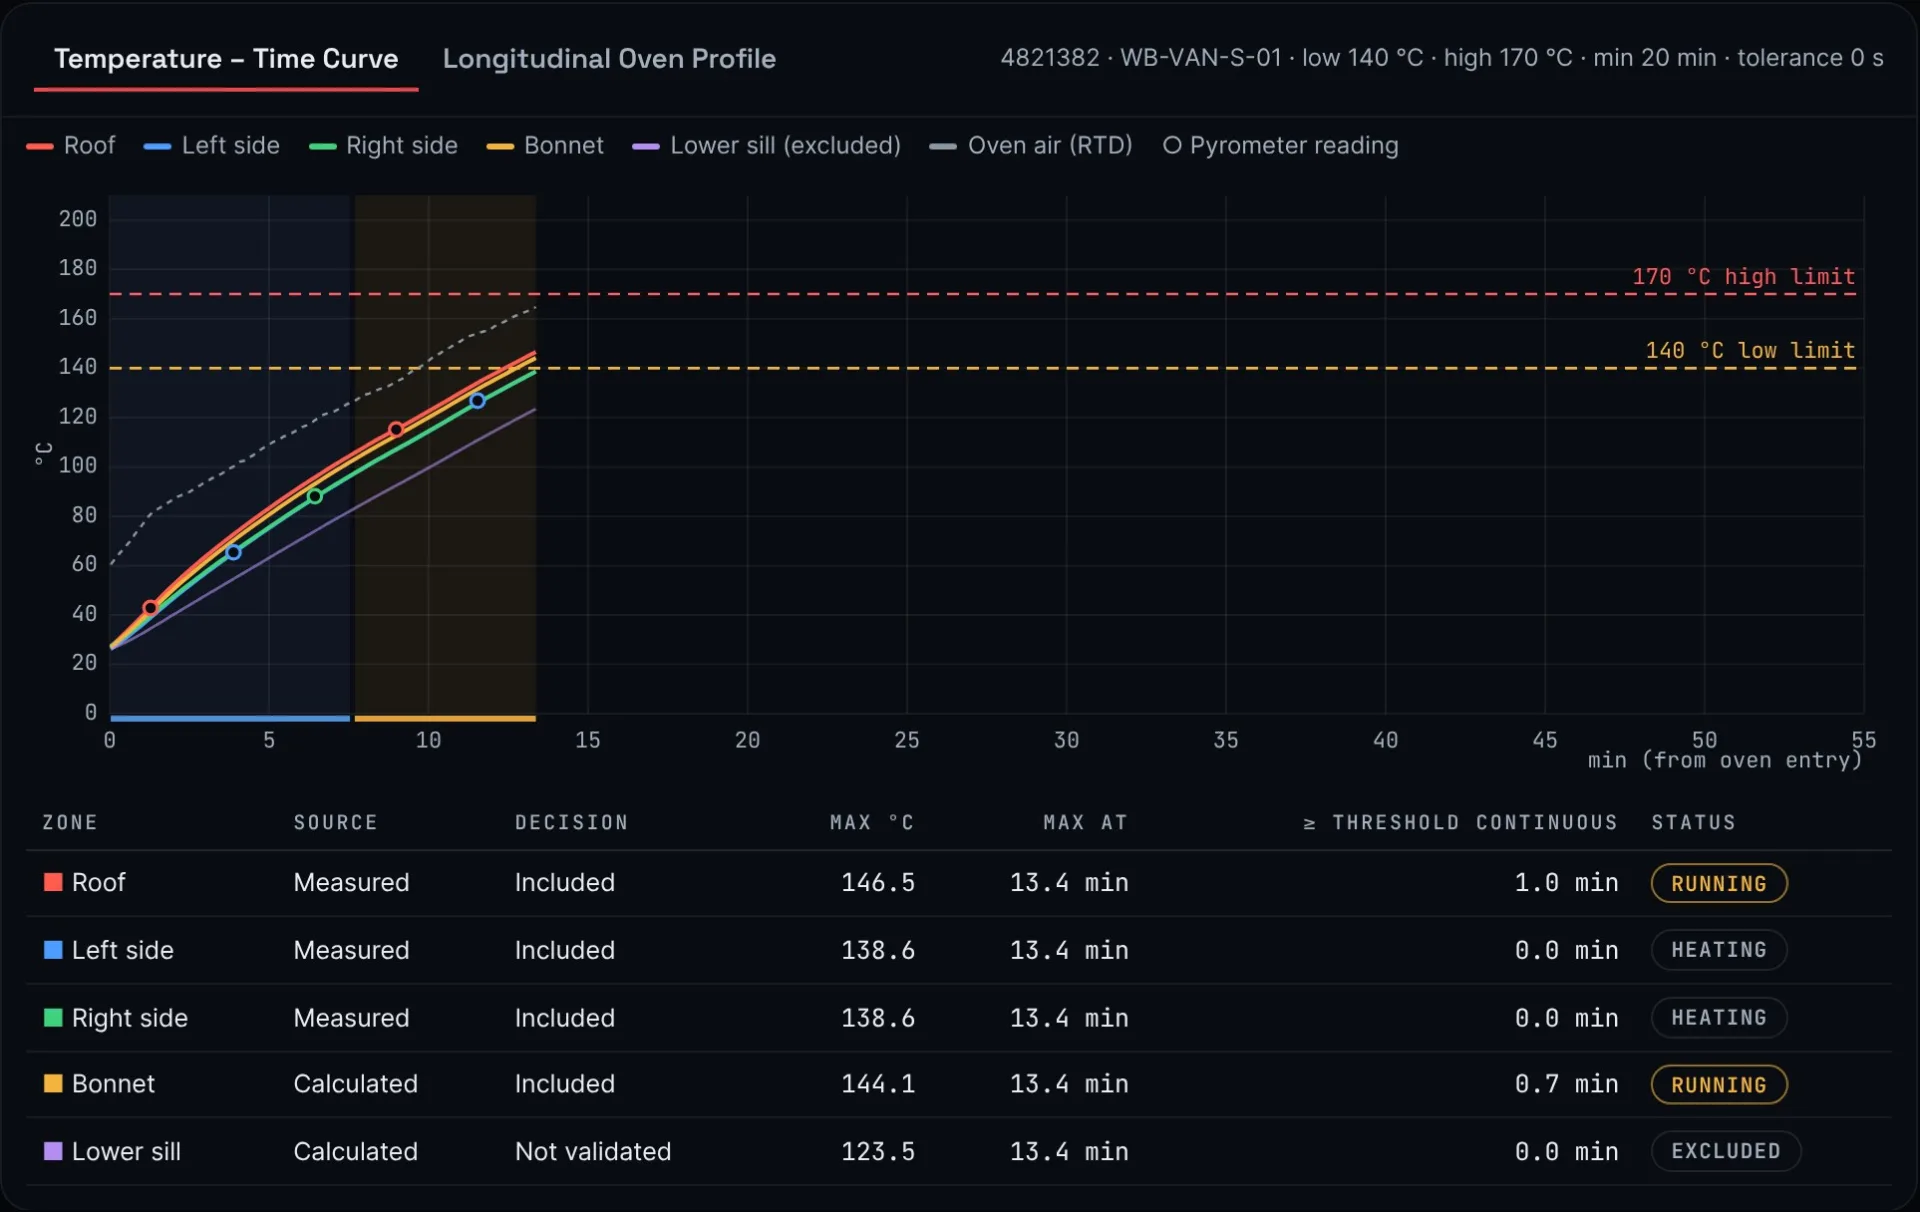
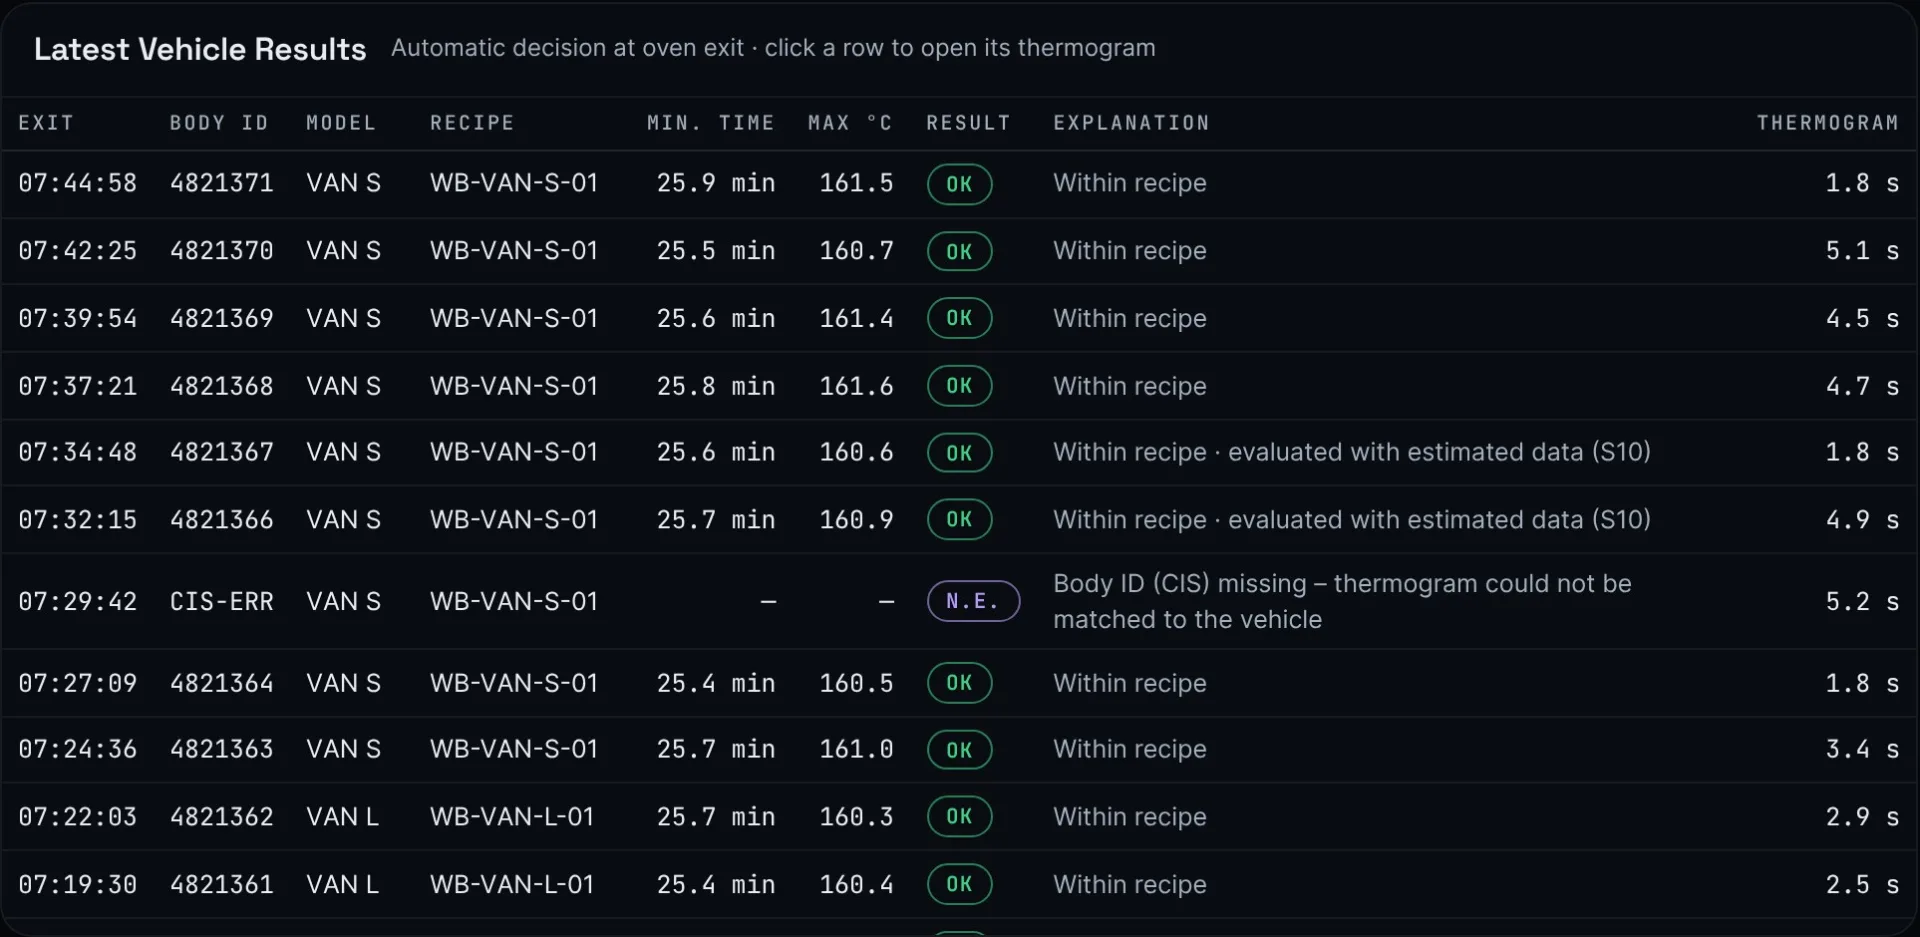
Eighteen hybrid stations line the oven tunnel. Each one reads the sheet surface with an IR pyrometer and the local air with an RTD. Every reading is matched to a specific body through the conveyor encoder and the CIS vehicle ID. A physics-guided thermal model fills the gaps between stations, producing a continuous curve for the roof, both sides, the bonnet and the lower sill. Within 60 seconds of oven exit the body is classed as OK, NOK or Not evaluable against its recipe, and each state goes to the PLC as its own signal. Calculated zones are validated against Datapaq reference runs and stay out of the decision until they are. If sensor, encoder, ID or PLC data is missing, the system never issues an automatic OK.
What you can try in the live demo
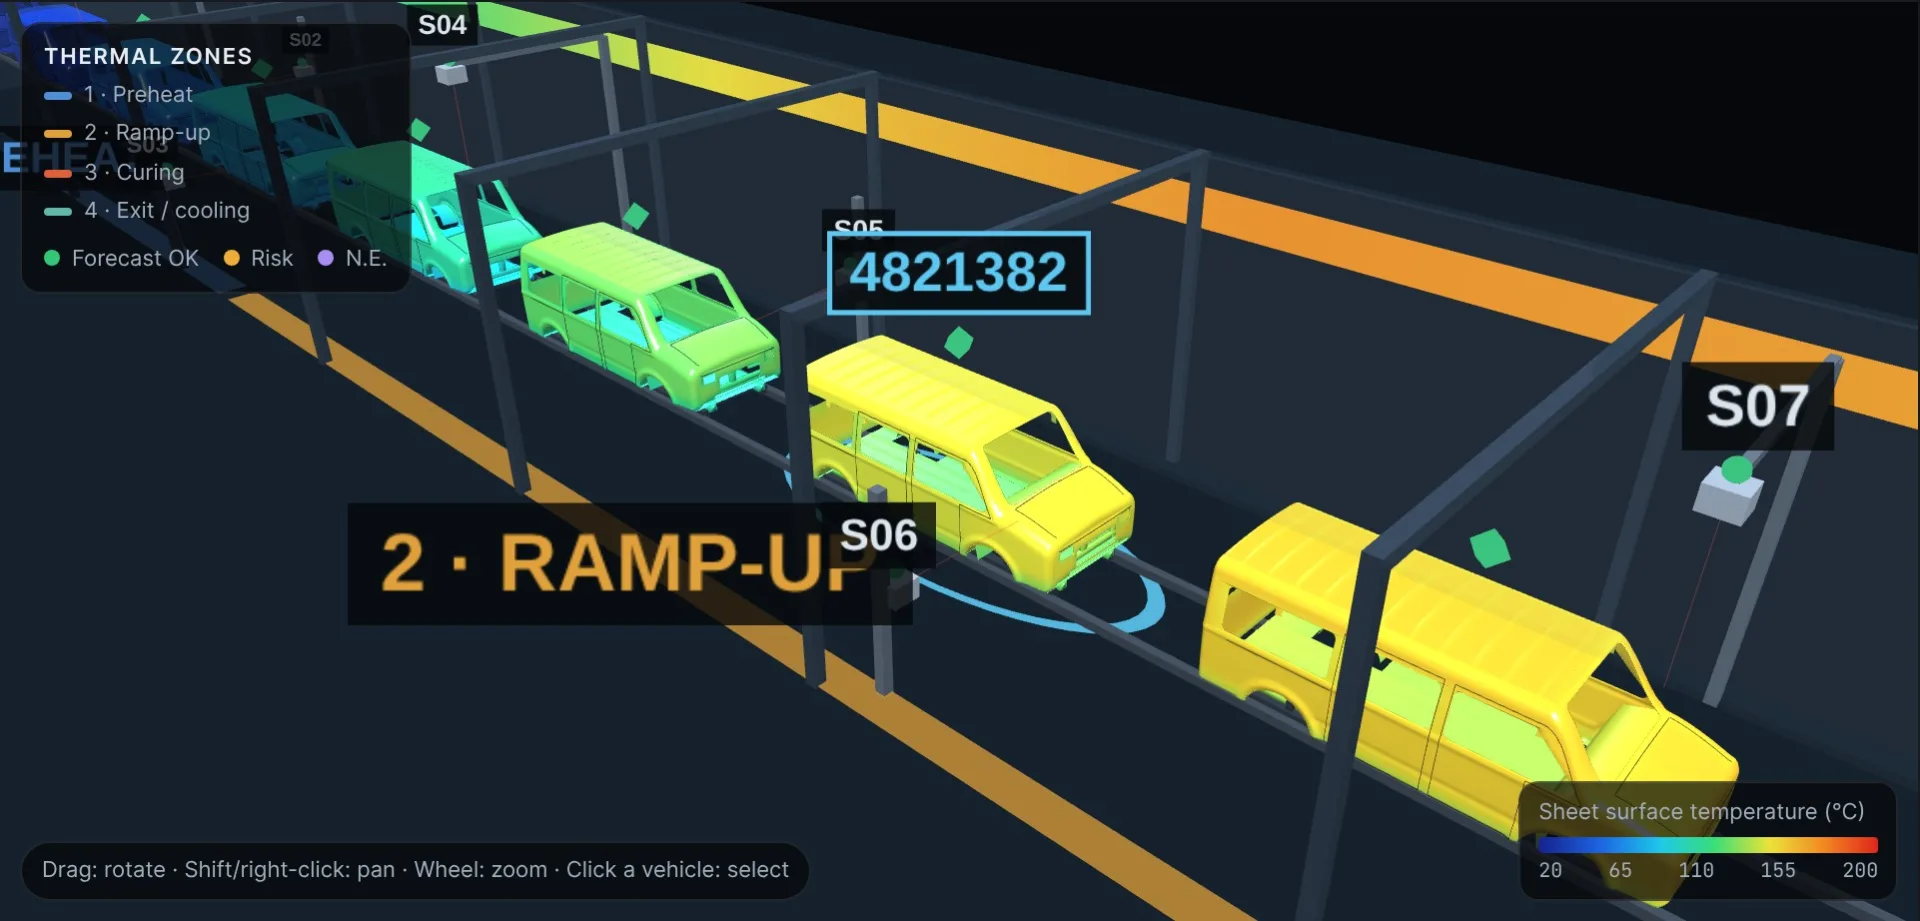
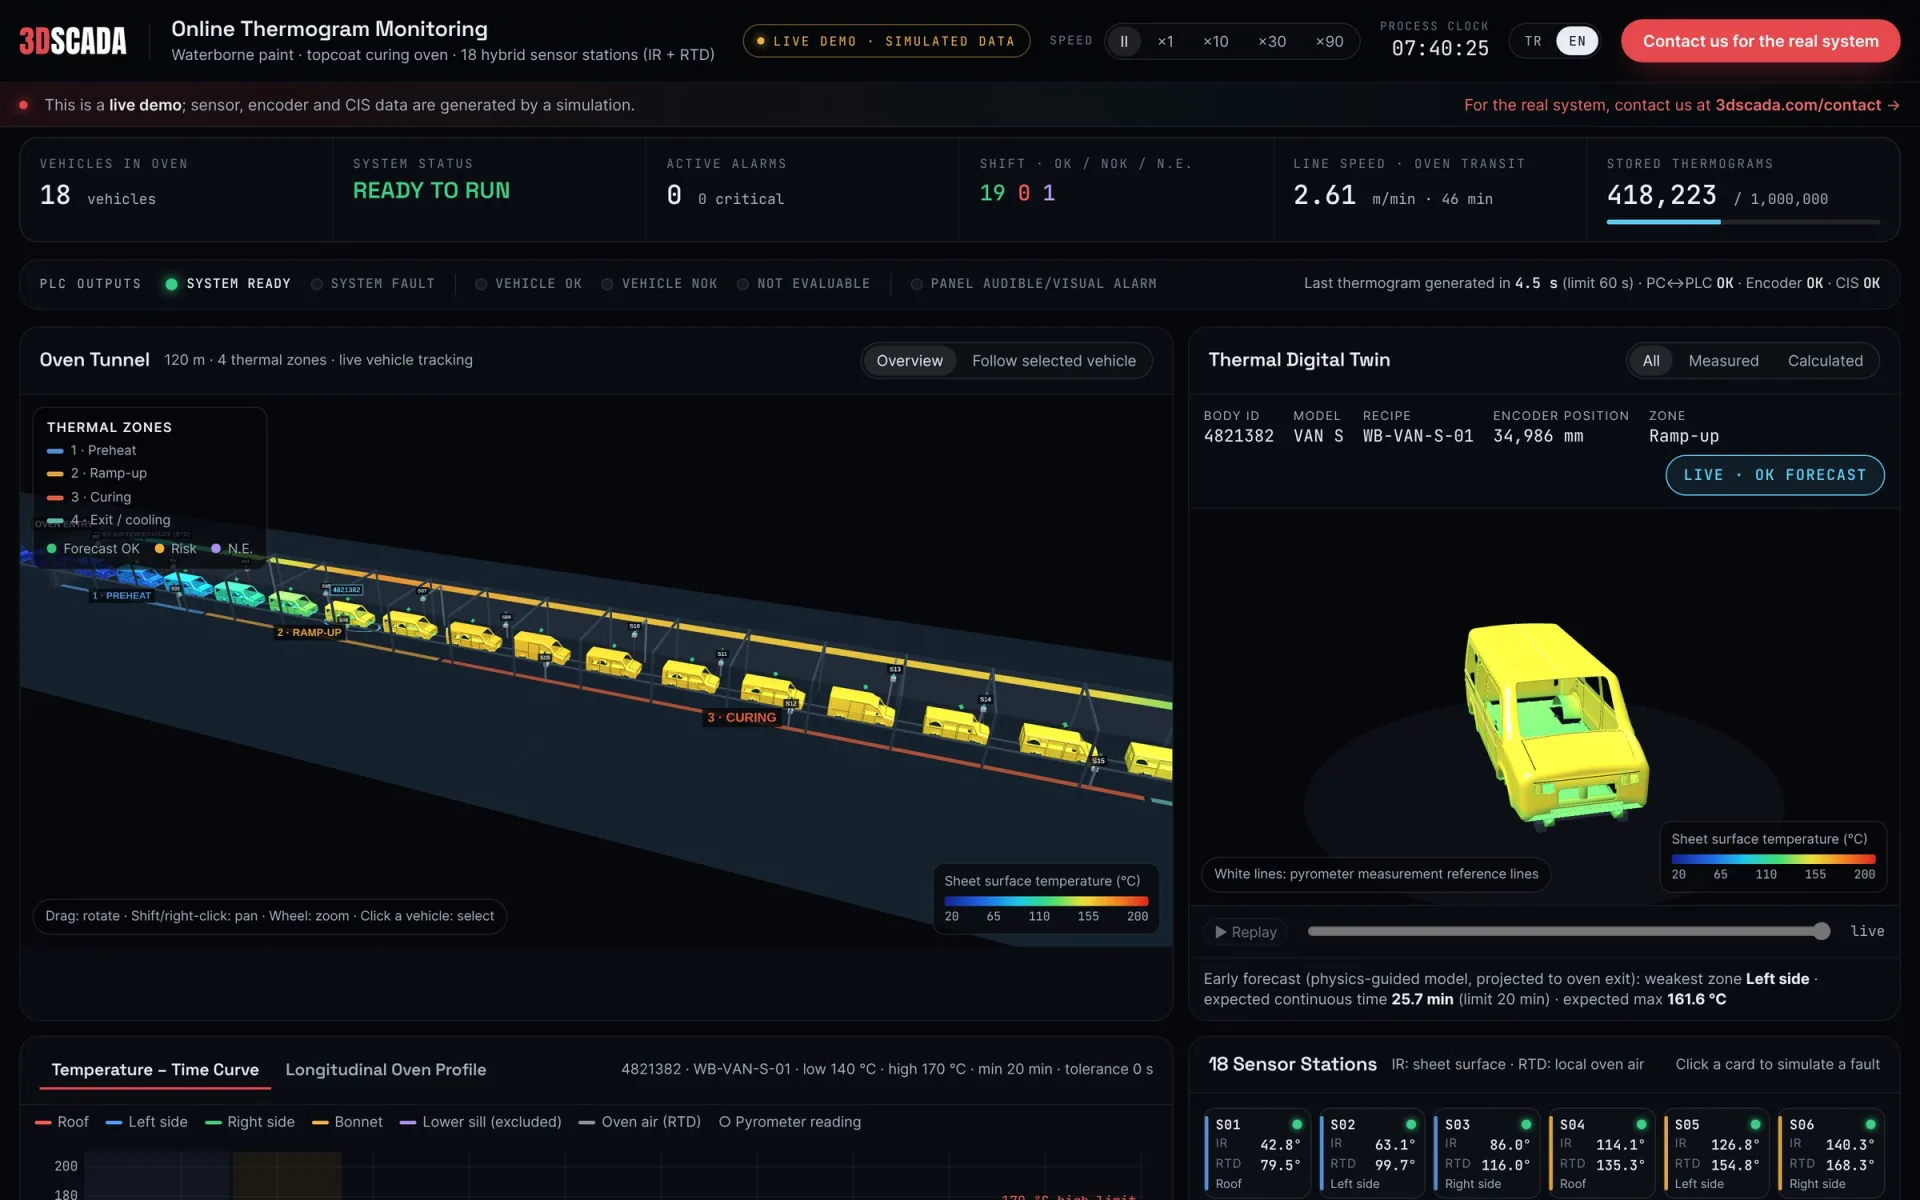
- Bodies moving through a 120 m oven tunnel with live readings from all 18 sensor stations
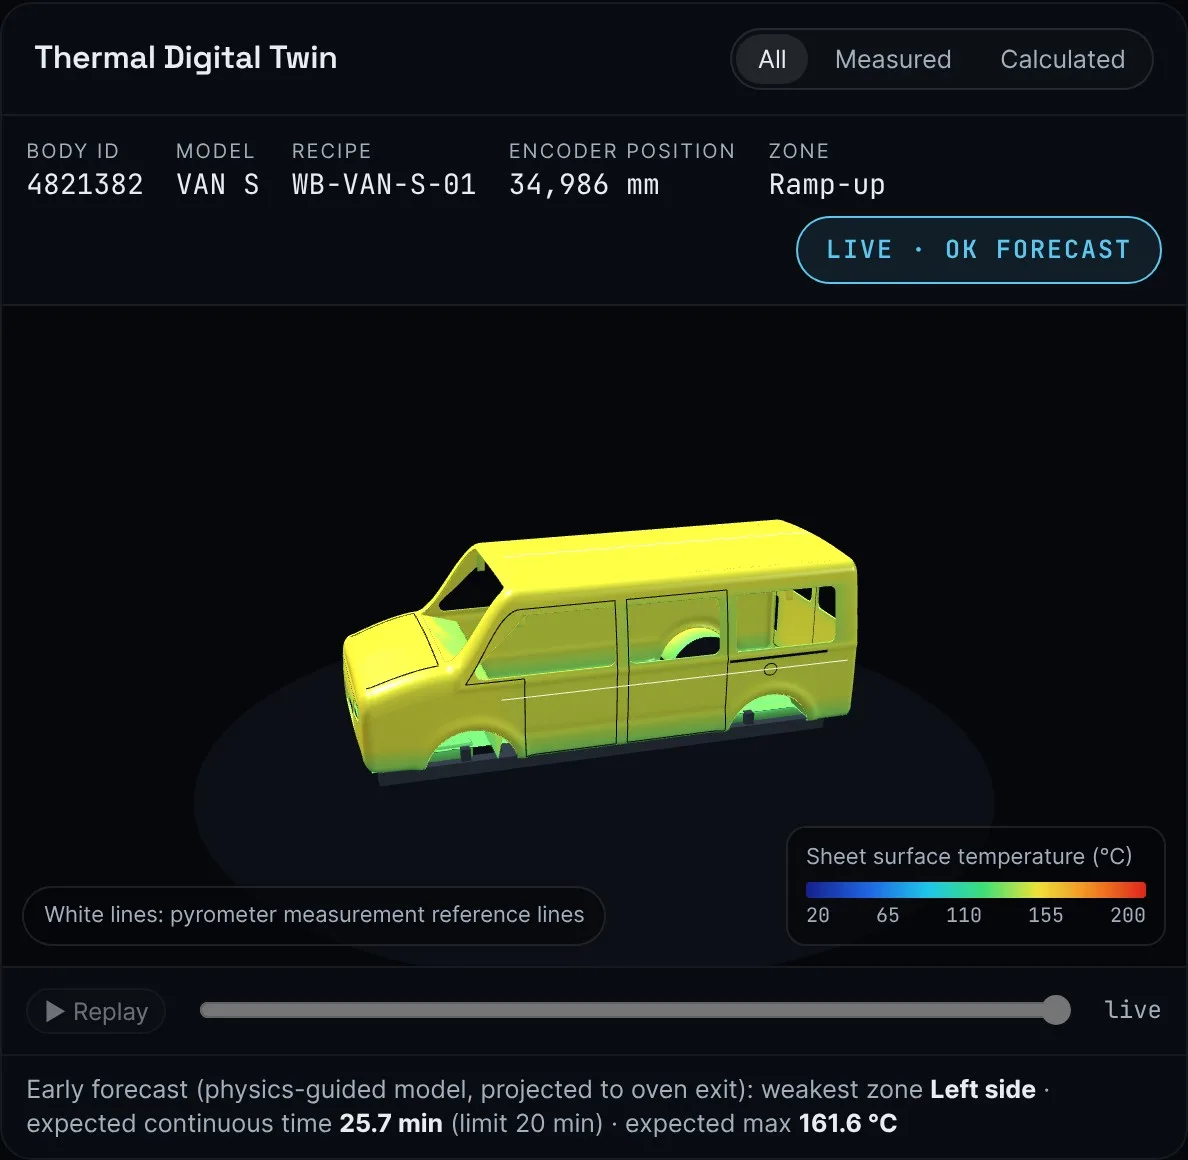
- A 3D thermal digital twin of the selected body, with measured and calculated zones shown separately
- Temperature–time curves, the longitudinal oven profile and continuous time above threshold per zone
- Fault scenarios: burner drop, over-temperature, PLC link loss, encoder loss, CIS error, line stop and power outage
- Recipe limits that only an authorised user can change, with a full event log
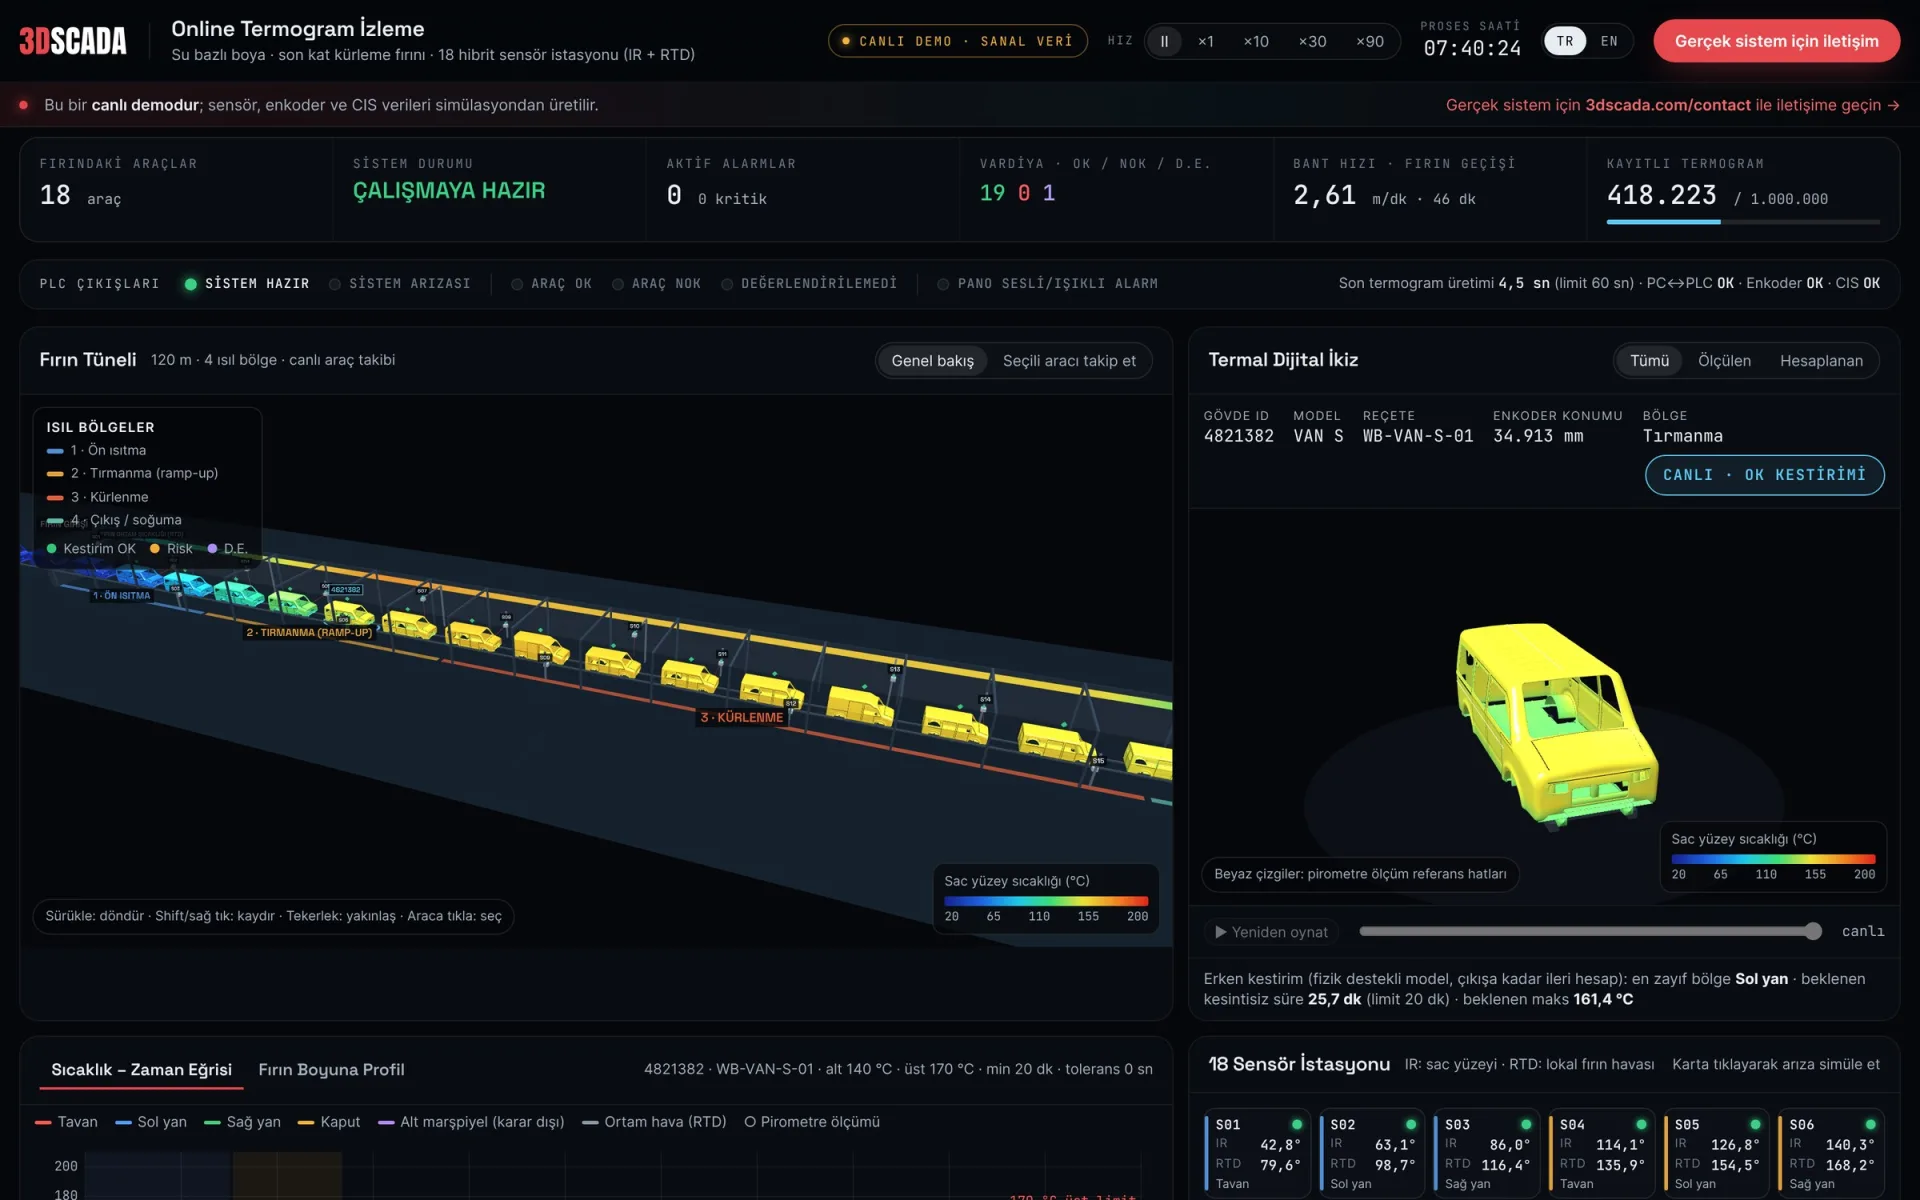
The demo runs on simulated data and is available in English and Turkish. To discuss a real installation, reach us at 3dscada.com/contact.
Features
Key capabilities
- 18 hybrid stations: IR pyrometer on the sheet, RTD on the local oven air
- Per-vehicle data matching via conveyor encoder and CIS ID
- Physics-guided model for a continuous curve between stations
- 3D thermal digital twin with measured and calculated zones kept apart
- OK / NOK / Not evaluable verdicts as separate PLC signals
- Thermogram ready no later than 60 s after oven exit
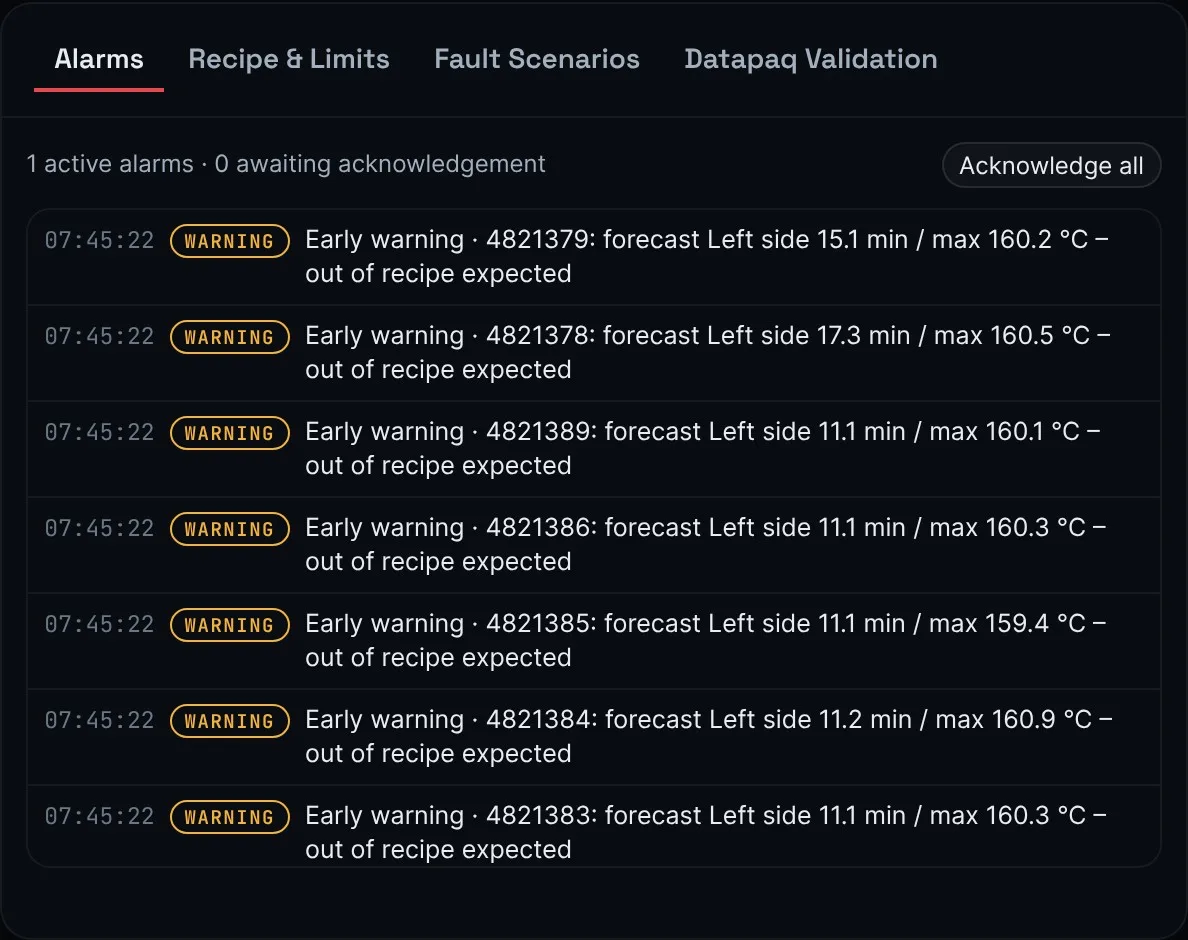
- Early anomaly forecast flags NOK risk before the body leaves the oven
- Archive for 1,000,000 vehicle thermograms with role-based limit control
6 images
Gallery
Outcomes
- hybrid measuring stations
- 18
- thermogram per vehicle
- ≤ 60 s
- per-vehicle cure verification
- 100%
- vehicle thermograms archived
- 1 M
Services
Related services
Real-Time Systems
Manage your operations in milliseconds and increase efficiency with real-time data.
3D Modeling & Digital Twin
Achieve operational excellence by bringing your physical assets to life in the virtual world.
Process Analysis
Uncover inefficiencies, bottlenecks, and hidden potential in your production processes.
Interactive 3D Web
Allow your customers to inspect your products from every angle and increase conversion rates.
FAQ
Frequently asked questions
Does this replace Datapaq profiling?
The online system watches every vehicle in daily production, while Datapaq stays as the reference. Model-calculated zones are validated with Datapaq probes placed at the same spot, and an unvalidated zone never takes part in the quality decision.
What happens if a sensor or a data link fails?
A body with missing ID, position tracking or sensor data never receives an automatic OK. It is stored as “Not evaluable” and a separate signal goes to the PLC. If only a single station drops out, the model estimate can be used within limits agreed in advance.
Can it be retrofitted to an existing oven?
Yes. The stations mount along longitudinal lines inside the tunnel, and encoder and CIS data come from the existing line. After a site survey we lay out the sensors, the PLC interface and the panel design for that specific oven.
Is the data in the live demo real?
No. Sensor, encoder and CIS values in the demo come from a thermal simulation and the body models are representative. For a system running on your plant data, contact us at 3dscada.com/contact.
Projects
Other projects
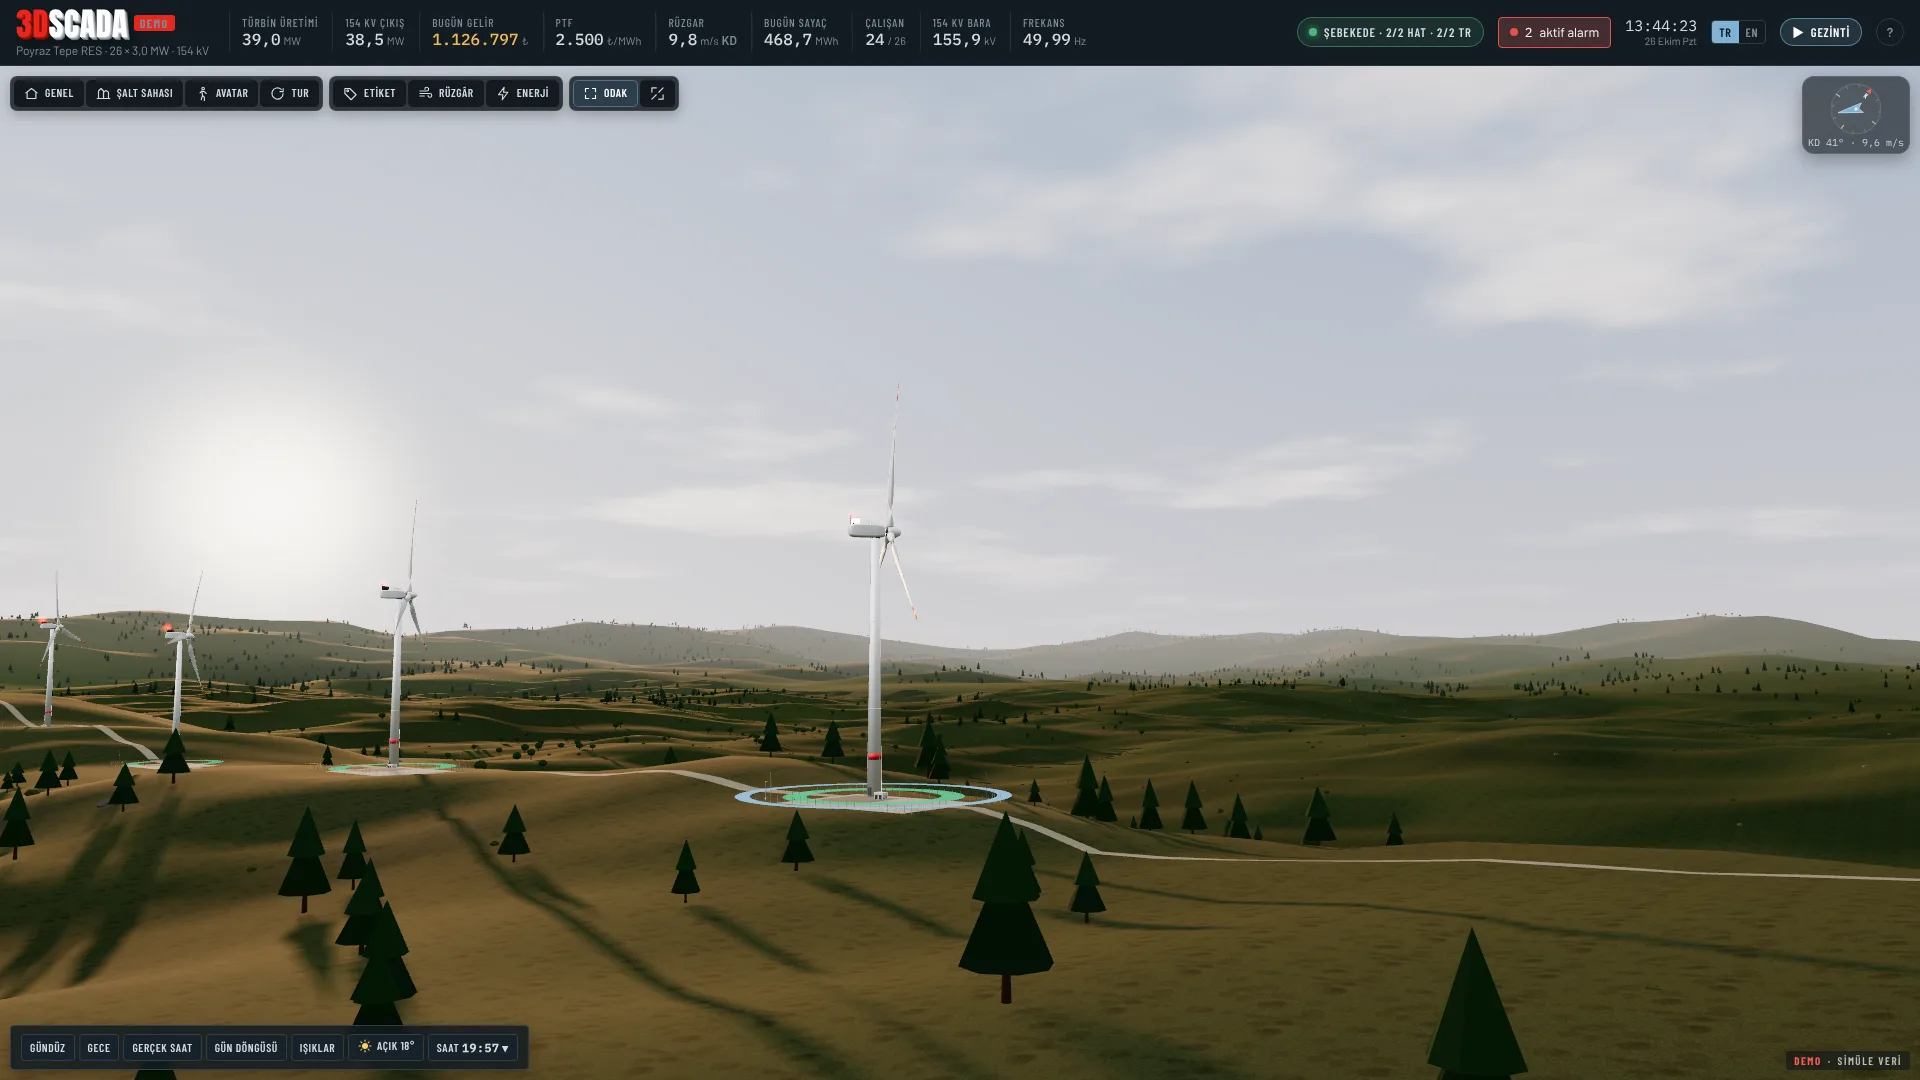
Wind Farm 3D SCADA
A SCADA demo that lets you monitor and operate a wind farm in 3D, from inside the nacelle to the grid connection. Day and night, rain, snow, fog and storms all affect the plant realistically.
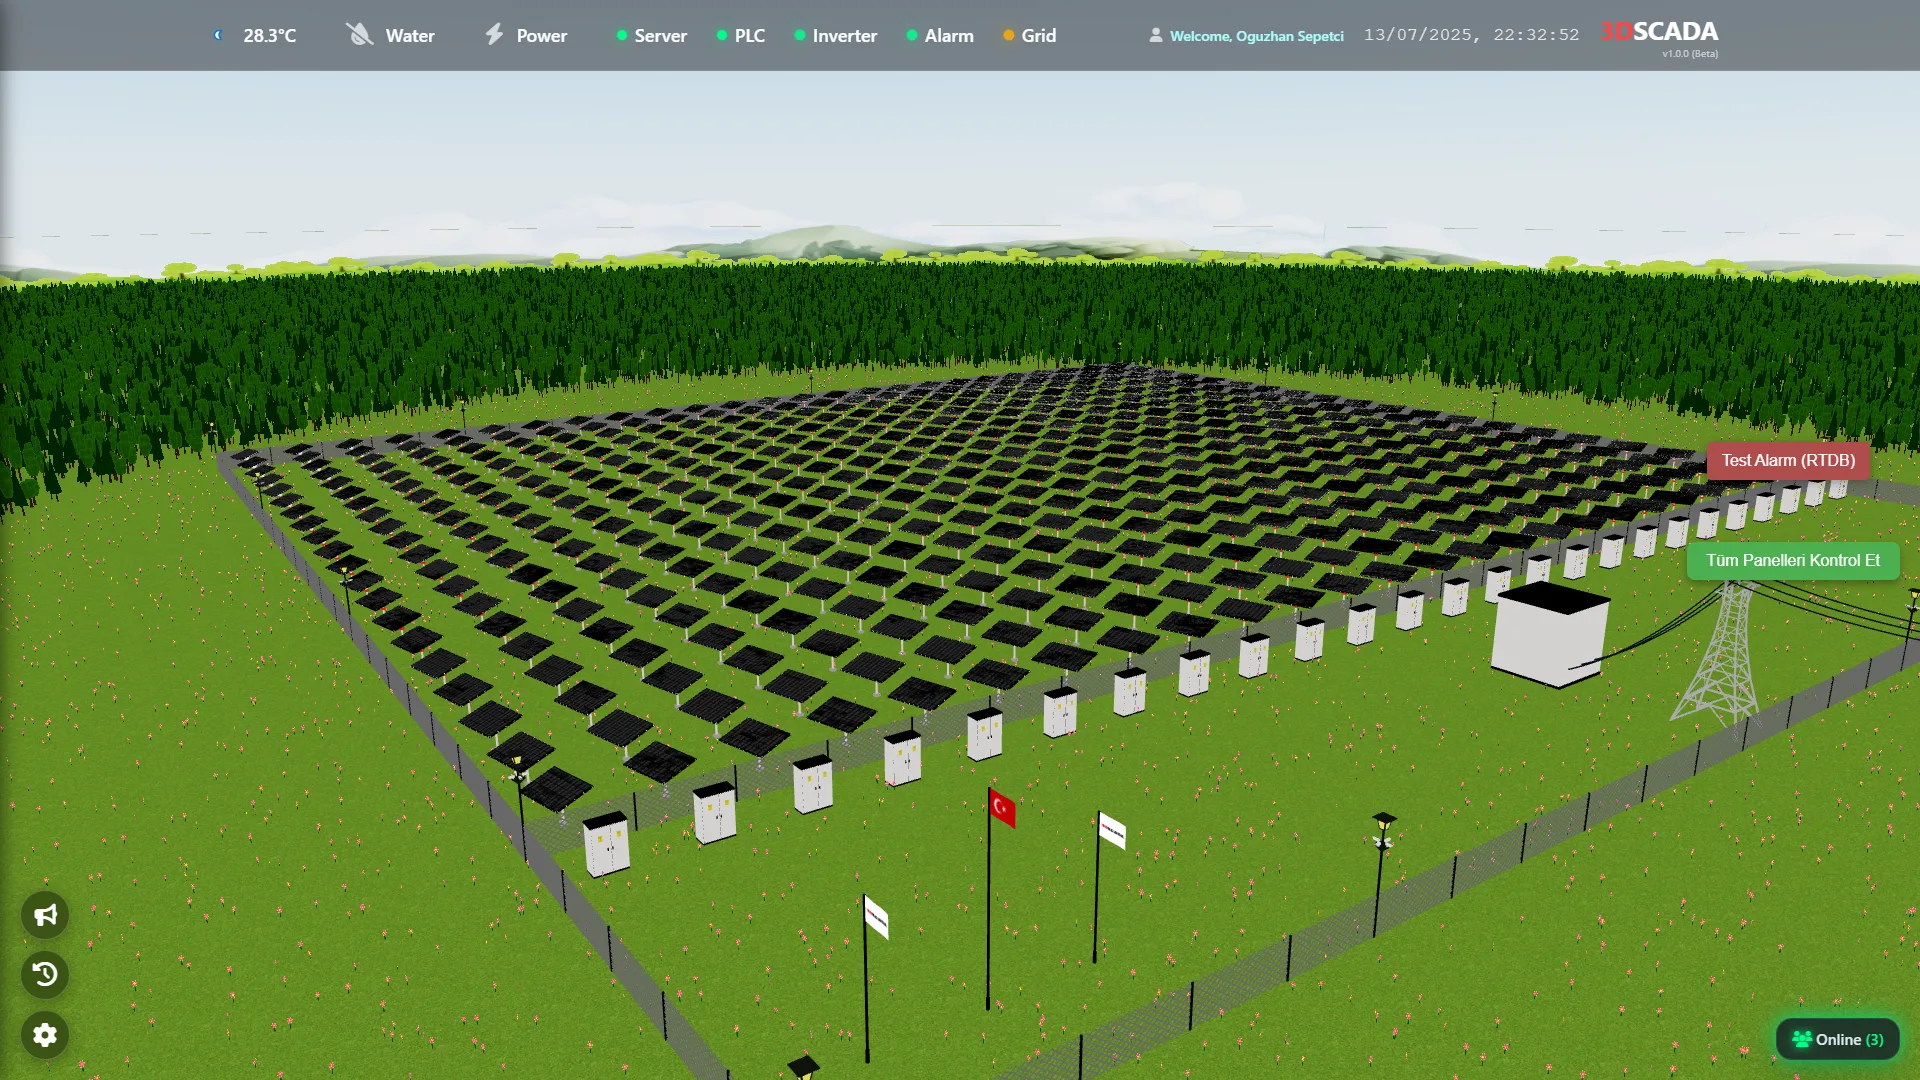
SPP 3DSCADA System
Watch the 3DSCADA sample project video... Contact us for a live demo...
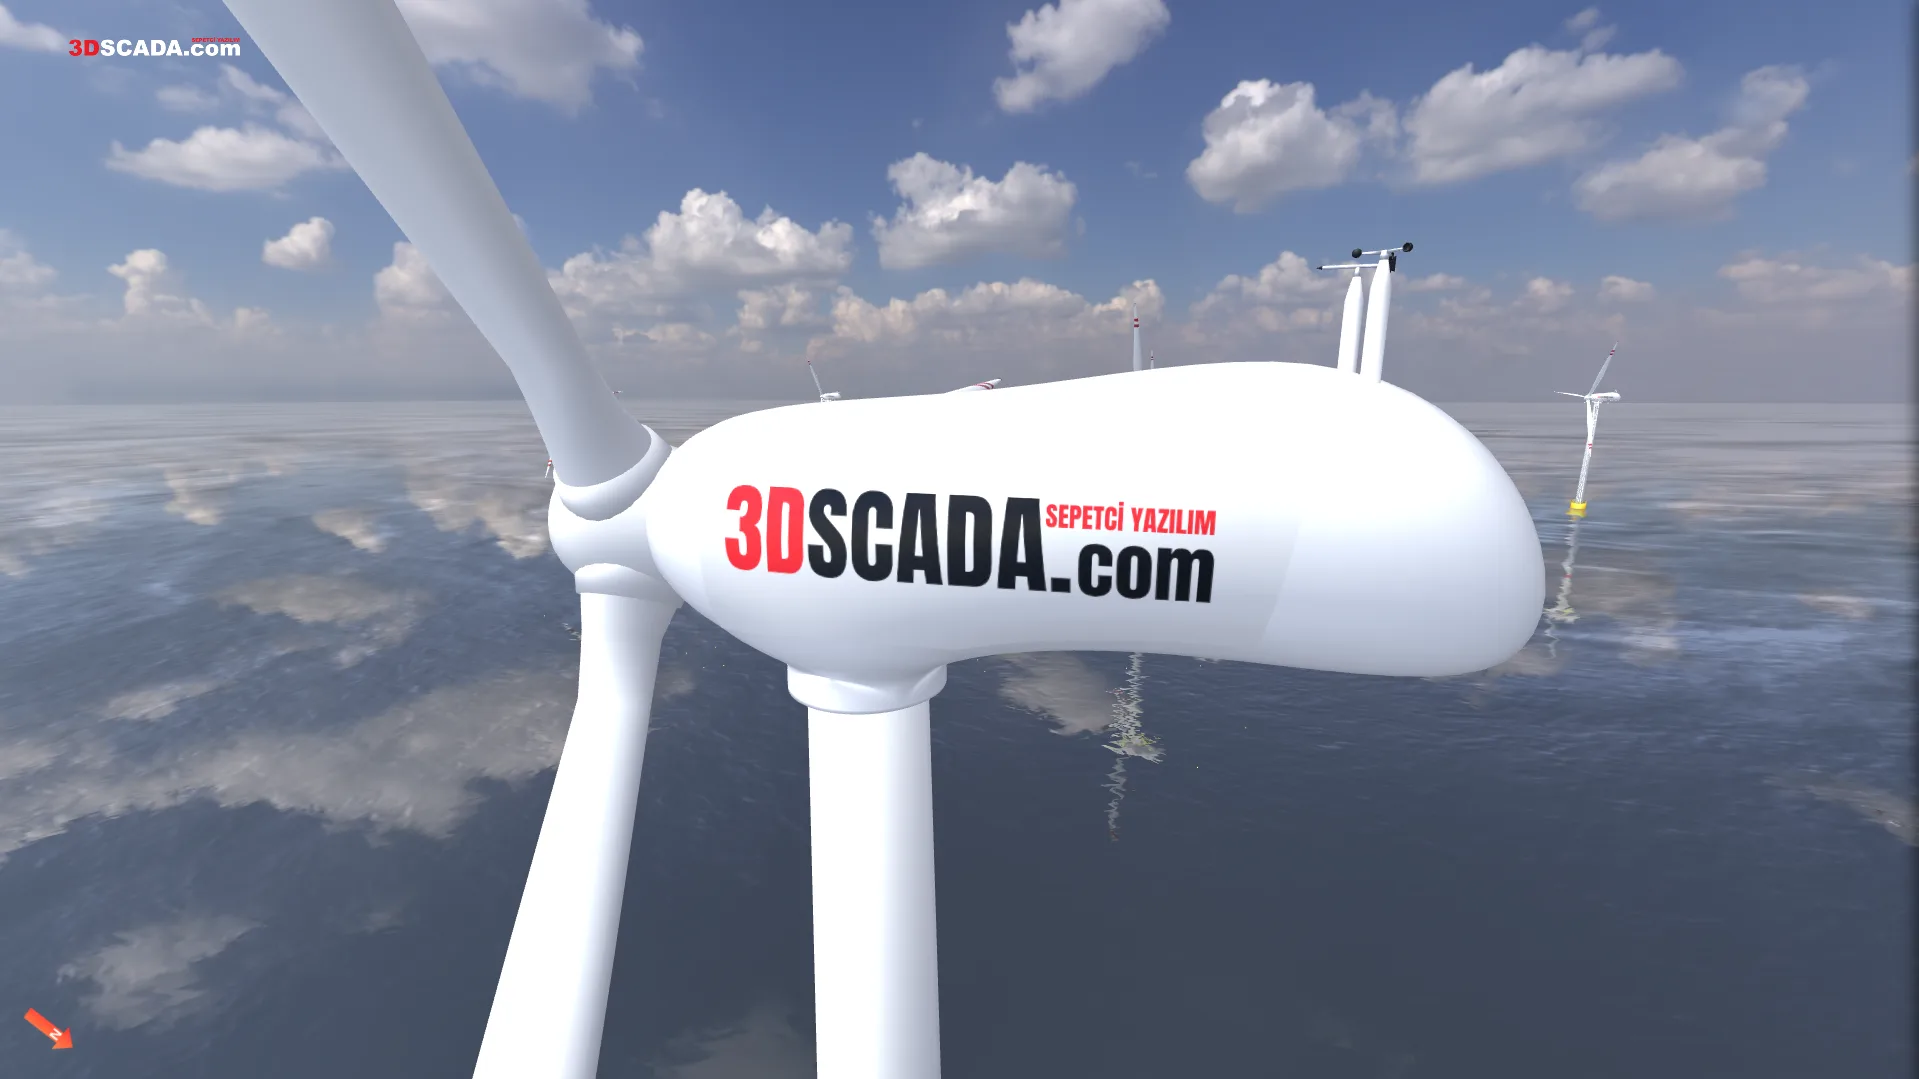
WPP 3DSCADA System
Real-time monitoring and control system for a wind power plant.
Ready to bring your project to life?
Contact our expert team and discover your custom solution.